D–01Data
How Architects Actually Use AI in 2026: 7 Surveys Compared
On this page
- How many architects actually use AI in 2026?
- Which surveys are we comparing?
- Why do the surveys disagree so much?
- What do architects actually use AI for?
- Which AI tools do architects use?
- Does AI save architects time or money?
- What stops architects from using AI more?
- Do practice size and age change the picture?
- What does this mean for your practice?
- FAQ
- Sources
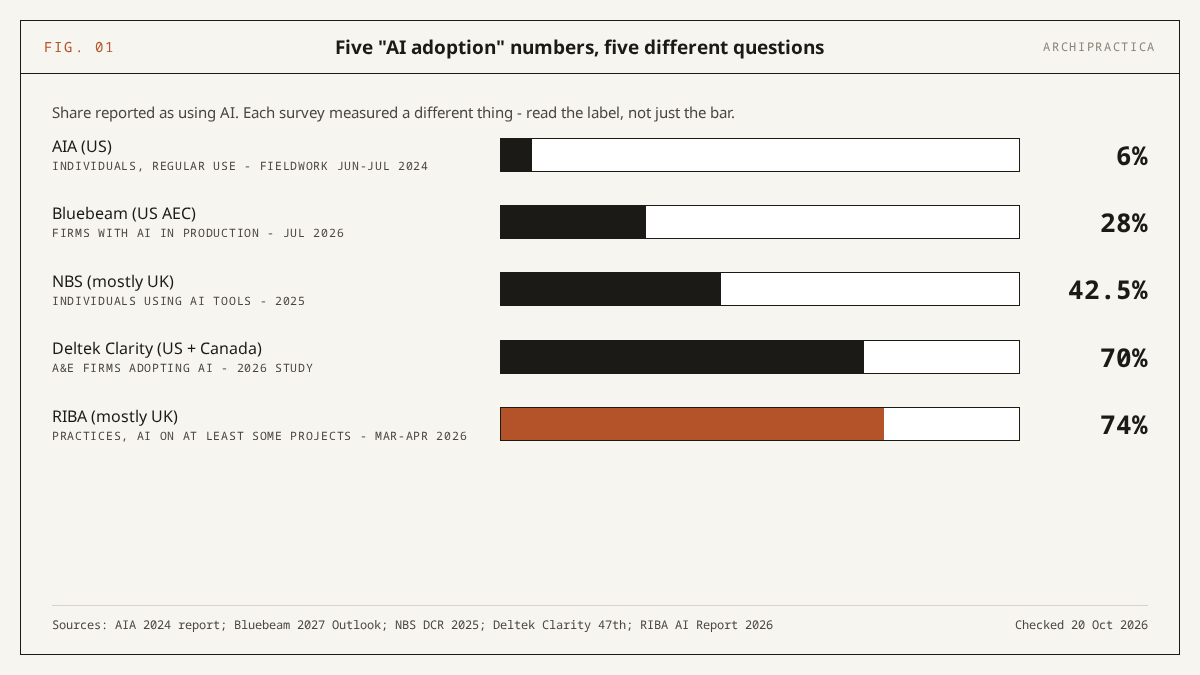
Most architecture practices now use AI somewhere, and most of them use it lightly: the RIBA AI Report 2026 (survey March-April 2026) found 74% of practices using AI on at least some projects, while only 15% say AI is embedded in day-to-day work. The dominant uses are early-design visualisation (56% of AI-using practices in RIBA’s data) and text and admin work - drafting, technical research, reports, bids - which leads every survey that asks about text. That is the short version of how architects use AI in 2026; the longer version depends on which survey you read, because the published adoption figures run from 6% to 74%.
We did not run a survey of our own. This article is a synthesis of seven published surveys of how architects use AI - RIBA, AIA, Chaos with Architizer, NBS, Bluebeam, Deltek and the Architects’ Journal - and we checked every number below against the publisher’s own report or press release on 20 October 2026, reading the PDFs ourselves. Where a press release and its report disagree, we say so and use the report.
How many architects actually use AI in 2026?
Between 6% and 74%, depending on what you count. The most recent professional-body figure is RIBA’s: 74% of UK practices use AI on at least some projects in 2026, up from 59% in 2025 and 41% in 2024, and 31% use it on every or most projects. Counts of individuals who use AI regularly, firms with AI in production, or practices where it is embedded come out far lower in every survey.
According to the RIBA AI Report 2026 (survey March-April 2026, over 1,100 respondents), 62% of practices are still starting to explore AI, 17% are formally trialling it and 15% describe it as embedded in day-to-day work. The 74% headline therefore contains a large majority of practices that are experimenting.
The US professional-body figure is older and much lower. According to the AIA’s AI adoption study (fieldwork June-July 2024, report published late 2024), only 6% of the profession regularly use AI for their jobs, 53% have experimented without using it regularly, and 8% of firms have implemented AI solutions with a further 20% working on it. This is the latest AIA AI survey we could find on 20 October 2026.
Construction-wide and vendor surveys sit in between. The NBS Digital Construction Report 2025 (fieldwork 2025, published October 2025) found 42.5% of respondents already using AI tools, up from 9% in 2020 and 22% in 2023; the RIBA Journal’s breakdown (15 October 2025) puts architecture professionals at 49%.
Deltek Clarity (12 May 2026, 896 A&E firms) reports AI adoption rising from 53% to 70% year over year. Bluebeam’s 2027 AEC Technology Outlook (fieldwork July 2026, published 13 October 2026) finds only 28% of AEC firms have moved AI into production and 7% have embedded it across multiple core workflows.
Which surveys are we comparing?
Seven surveys of how architects use AI, published between late 2024 and October 2026: three from a professional body or the trade press (RIBA, AIA, Architects’ Journal), one from a specification platform (NBS), and three from software vendors (Chaos with Architizer, Bluebeam, Deltek). They differ in sample, geography and in what counts as “using AI”, so the table lists those before the headline figure.
Two editions are older than we would like. None of the data is ours: we ran no survey, and every figure below comes from the publisher’s own document.
| Survey (publisher) | Published | Fieldwork | Sample | Geography | Who answered | What “uses AI” means | Headline figure |
|---|---|---|---|---|---|---|---|
| S1. Artificial Intelligence Report 2026 (RIBA) | 22 July 2026 | March-April 2026 | Over 1,100 respondents, self-selecting | UK (around 10% based outside the UK) | Practice staff, architects the largest group; 51% small practices (1-9), 22% medium, 27% large | Practice uses AI at least sometimes on current projects | 74% of practices; 31% on every or most projects |
| S2. AI Adoption in Architecture Firms: Opportunities & Risks (AIA, with Deltek and ConstructConnect) | Late 2024 (the PDF states both November and December); press release 11 March 2025 | June-July 2024 | 541 completed surveys from a random sample of 10,000 AIA contacts | US | AIA members, senior skew (55% over 50, 51% partners or principals) | Individual regularly uses AI for their job | 6% regular use; 53% experimented; 8% of firms implemented |
| S3. How AI Is Reshaping Architectural Design & Visualization in 2026 (Chaos and Architizer, 4th edition) | 2026 (analysis December 2025-January 2026) | November 2025 | Nearly 800 respondents, invited from Architizer members, Chaos users and the wider AEC community | 50% North America, 22% Europe, 10% Asia | 70-71% architecture, 25% interior design; 60% firms up to 19 people | Has experimented with AI / is fully embracing it | 64% experimented; 20% fully embracing |
| S4. Digital Construction Report 2025 (NBS, 15th edition) | 7 October 2025 | 2025, month not stated | 559 responses (358 complete, 114 partial, 87 disqualified) | 72.3% UK | Construction-wide; 66.5% consultants, designers or specifiers; architects 24% of respondents | Individual already using AI tools at work | 42.5% of all respondents; 49% of architecture professionals |
| S5. 2027 Building the Future: AEC Technology Outlook (Bluebeam, fieldwork by Hanover Research) | 13 October 2026 | July 2026 | 750 technology decision-makers (manager or above) | US | AEC firms: architecture, engineering and construction combined | Firm has moved AI into production | 28% in production; 7% embedded across multiple core workflows |
| S6. Clarity 47th Annual A&E Industry Study (Deltek) | 12 May 2026 | not stated | 896 A&E firms | US and Canada | Architecture and engineering firms combined, firm-level | Firm has adopted AI | 70% adopted (from 53%); generative AI 78% (from 64%) |
| S7. Changes in Practice survey (Architects’ Journal, supported by Deltek) | 3 October 2025 | not stated | Almost 200, self-selecting | Mainly UK | Architects and students | Individual uses text-based AI tools at least weekly | 64% weekly; 40% daily |
Data checked: 20 October 2026 against each publisher’s own report or press release. Fieldwork dates as stated by the publisher; ‘not stated’ where they don’t say.
Two labels matter. The AIA study is 2024 fieldwork and remains the latest AIA AI survey we could find; the NBS report is the 2025 edition, and the NBS downloads page listed no 2026 edition on 20 October 2026. RIBA’s own method note says its results “are best read as a good indication of AI and the profession, but not as definitive,” per the “About the survey” section of the report PDF. The same caution applies to NBS, Chaos and the AJ, where respondents opted in; only the AIA drew a random member sample.
Why do the surveys disagree so much?
Because they measure different things. AIA’s 6% counts individual architects who use AI regularly, drawn from a random sample of members in mid-2024. RIBA’s 74% counts practices that use AI at least sometimes, drawn from a self-selecting sample in spring 2026. Change the unit, the threshold, the date, the sampling method or the country and the number moves; none of the seven is wrong on its own terms.
Unit comes first. AIA and NBS count individuals; RIBA counts practices; Deltek counts A&E firms; Bluebeam counts AEC firms. A practice where one associate renders massing options in an image tool counts as “using AI” in RIBA’s question, while the colleagues around that associate would each answer “no” to AIA’s question about regular use.
Threshold explains more of the gap than the date does. “At least sometimes” (RIBA, 74%) sits above “has experimented” (Chaos, 64%; AIA, 53%), which sits above “already using” (NBS, 42.5%), “every or most projects” (RIBA, 31%), “in production” (Bluebeam, 28%), “embedded” (RIBA, 15%; Bluebeam, 7%) and “regularly” (AIA, 6%). Most practices say they have tried AI. Far fewer say they have rebuilt a workflow around it.
Date, sampling and geography do the rest. AIA’s fieldwork ran June-July 2024, RIBA’s March-April 2026, and RIBA’s own series rose from 41% to 59% to 74% across those years. Chaos surveyed Architizer members, users of its own visualisation software and the wider AEC community, so its image-heavy results reflect who answered. AIA and Bluebeam are US, Deltek US and Canada, RIBA and the AJ mainly UK, NBS 72.3% UK.
Numbers also drift between a report and the coverage of it. RIBA’s news release (22 July 2026) says 75% of AI users report improved productivity; the report body says 73%, with 25% reporting no change and 2% worse, and we use the report’s 73%. The Architects’ Journal write-up of the RIBA report (23 July 2026) described the 74% as practices using AI on most projects, while the RIBA data puts every-or-most-projects use at 31%. Small slips, with large consequences if you quote them in a board paper.
What do architects actually use AI for?
Images at the front end and text everywhere else. In RIBA’s 2026 data, early-stage design visualisation leads at 56% of AI-using practices, then compliance checking at 40%, practice management at 32% and specification or technical design at 24%. Surveys that ask about text work find it dominant: NBS puts technical information search at 71.1% and text drafting or review at 63.8% of AI users, and the AJ finds 64% using text tools weekly.
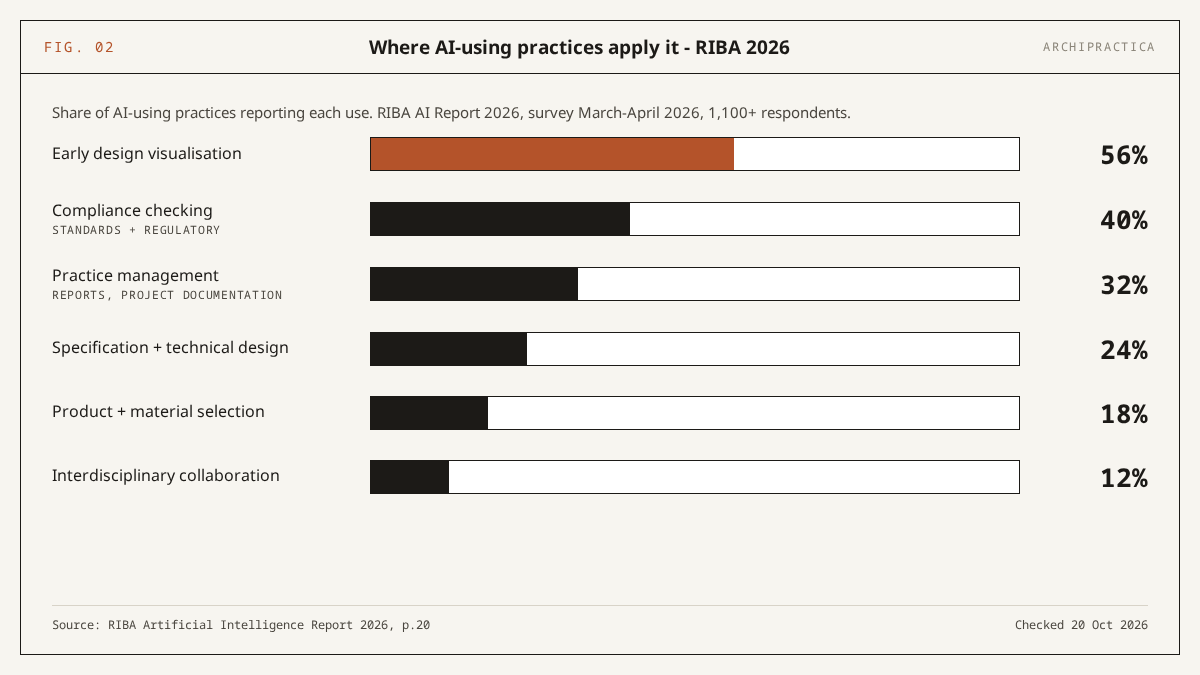
The rest of the RIBA list, per the report PDF (survey March-April 2026): construction product or material selection 18%, interdisciplinary collaboration 12%, and up to 10% for BIM, performance simulation or environmental impact modelling. RIBA changed its question set this year, so these figures are not comparable with its 2024 and 2025 editions. The table puts the five surveys that report tasks side by side.
| Task family | RIBA 2026 | NBS 2025 | Chaos 2026 | AJ 2025 | AIA 2024 |
|---|---|---|---|---|---|
| Early-design images and visualisation | 56% early-stage design visualisation | not reported | 40% image generation from model inputs; 40% from text prompts; 35% image enhancing; 16% video | 26% image tasks at least weekly (8% daily); 39% at concept design | 44% content production (image and video generation, marketing messaging, grammar review), most common firm-wide application |
| Text drafting and review | not reported | 63.8% of AI users; 32% of architect respondents | not reported | 64% text-based tools at least weekly; 40% daily | grammar and text analytics among the most common applications, no figure |
| Technical research and information search | not reported | 71.1% of AI users; 31% of architect respondents | not reported | not reported | not reported |
| Compliance and code checking | 40% standards and regulatory compliance checking | not reported | 13% building code analysis | not reported | 16% code compliance |
| Specification and technical design | 24% specification writing or technical design | not reported | not reported (8% use layout or plan generation) | not reported | not reported |
| Practice management and admin | 32% general practice management (reports, project documentation) | not reported | not reported | just over 40% practice administration | 23% client communications (used or explored) |
| Bids and RFPs | not reported | not reported | not reported | 39% at RFP or bid stage | not reported |
| Product and material selection | 18% | not reported | not reported | not reported | 4% have tried AI for product libraries |
Bases differ: RIBA, NBS (first figure) and Chaos report shares of AI users; the NBS architect figures, the AJ and the AIA report shares of all respondents. Data checked: 20 October 2026.
The compliance figure deserves a plain warning. 40% of AI-using practices in RIBA’s survey apply AI to standards and regulatory compliance checking, and the AIA (2024) found 16% had used or explored AI for code compliance. AI output there is a starting point that a licensed professional must verify against the current code edition in the applicable jurisdiction: the tools cite superseded section numbers and default to the wrong jurisdiction unless told otherwise. Our guide to AI building code checks shows where exactly they break, and the specification guide covers the same rule for the 24% using AI on specs.
The text-first pattern shows up in the open answers too. One respondent to the AJ survey (3 October 2025) put it this way: “I use ChatGPT regularly for simple text-based tasks - for bid documents, presentations, planning documents and building control statements.” The AIA found AI mainly used in already fairly efficient areas such as client communications (23%), while only 4% had tried it on product libraries, the area 51% called inefficient.
Which AI tools do architects use?
ChatGPT, by a wide margin in every survey that asks. The NBS Digital Construction Report 2025 (fieldwork 2025) puts ChatGPT at 86.8% of AI users, Microsoft Copilot at 57.9%, Google Gemini at 36.8%, company-specific tools at 21.7% and Claude at 15.1%. The Architects’ Journal survey (3 October 2025) found ChatGPT used by 77% and Copilot by 27%, up from 13% in 2024.
Image tools moved the most in the AJ data: Midjourney fell from 42% to 22% of respondents between the 2024 and 2025 surveys, while text-tool use reached 64% weekly. The AIA’s 2024 list of most common applications - chatbots, image generators, grammar and text analytics - matches that ranking. None of the seven surveys compares the tools on architectural tasks, and the NBS tool question covers the whole construction sample. If you are choosing between the two most common assistants, our 12-task comparison of Claude and ChatGPT for architects covers brief audits, code lookups and spec writing with the failure modes recorded.
Does AI save architects time or money?
Architects report saving time, and few yet report earning more from it. Among RIBA’s 2026 AI users, 73% say productivity has improved, 57% of those assessing return on investment call it positive, and 7% agree AI has allowed the practice to increase fees. Chaos (November 2025) finds 86% of users saving time and 59% saving at least 5 hours a week. Deltek (May 2026) finds only 38% of A&E firms reporting measurable positive business impact.
According to the RIBA AI Report 2026 (survey March-April 2026), 25% of AI users saw no productivity change and 2% saw it worsen; on ROI, 41% were neutral and 2% negative. The Chaos and Architizer report (fieldwork November 2025) splits its 86% into 55% who “saved time on certain tasks” and 31% who “significantly sped up” work, with 69% somewhat satisfied and 19% very satisfied.
The quality and fee picture is weaker. In RIBA’s survey 17% agree “our designs are better because of AI” and 42% disagree; on fees, 58% disagree that AI has let them charge more. In the Chaos survey 60% say AI “enhances some aspects but introduces new errors or inconsistencies”. Deltek (12 May 2026) reports 39% of A&E firms saying it is too early to see benefits or that they are still piloting.
Some firms past the pilot stage report substantial savings. According to Bluebeam (fieldwork July 2026), 40% of firms running AI in production report savings exceeding $500,000. That covers only the 28% of US AEC firms that reached production, so we read it as a ceiling.
What stops architects from using AI more?
Inaccurate output leads by a wide margin. The Architects’ Journal survey (3 October 2025) found inaccuracy the most-cited barrier at 55%, Chaos (November 2025) found poor output quality or unreliable results the biggest obstacle for 48%, and the AIA (2024) found 90% concerned about inaccuracies, unintended consequences, security, authenticity and transparency. Behind that sit integration, direction and policy.
Generic or unsatisfactory output was named by 47% in the AJ survey; poor integration with existing software by 33% in Chaos’s. Deltek’s A&E firms list not knowing where and how to apply AI (62%), integrating AI systems (56%) and data and cybersecurity (52%) as their top challenges. Bluebeam’s technology decision-makers see it differently: 50% cite high implementation costs as the biggest barrier to scaling and just 2% cite lack of trust in AI outputs.
Policy lags use. According to the RIBA report (survey March-April 2026), around 19% of practices have a documented AI policy, 17% are developing one and 15% plan to.
On jobs, 9% agree AI has led to staff reductions in their own practice (7% in 2024). Across the profession, 59% expect reductions across architecture and 61% agree AI will make it harder for early-career professionals to gain skills. 77% agree “AI can never replace human creativity”.
RIBA President Chris Williamson framed the stakes in the release (22 July 2026): “Professional oversight of design remains essential if tomorrow’s buildings are going to be safe and sustainable.” The 40% compliance figure above is where that sentence applies most directly.
Do practice size and age change the picture?
Practice size tracks AI use closely; years of experience make little difference until the 30-plus group, where adoption drops to 59%. RIBA’s 2026 survey finds more than 90% of practices with 50 or more staff using AI, 84% of medium practices (10-49) and 63% of small ones (1-9). Chaos finds 38% of firms with 100 or more employees fully embracing AI against 17% with five or fewer.
By years of experience, RIBA’s adoption figures are 80% at 1-5 years and 82% at 25-30 years. Adoption drops to 59% beyond 30 years.
Those RIBA figures come from the report PDF (survey March-April 2026), where 51% of respondents were from small practices, so the 63% small-practice figure rests on the largest part of the sample. The AIA’s 2024 sample skews the other way, with 55% over 50 and 51% partners or principals. For a small studio, the 63% is the useful comparator. RIBA does report AI policy by size: 56% of large practices have one, against 17% of medium practices, while 43% of small practices have no plans to develop one.
What does this mean for your practice?
Published data on how architects use AI gives you a benchmark, so use it as one. Each step below checks your practice against a published figure, and none of them requires buying anything. We make no claim about what the results will be for you; the numbers describe other practices at the dates stated above.
- Identify your stage among RIBA’s three. 62% of practices are starting to explore, 17% formally trialling, 15% embedded (RIBA, March-April 2026). If you are in the 62%, the question is whether to move to a trial with a named owner and an end date.
- Count projects. RIBA’s 74% counts practices using AI on at least some projects; only 31% use it on every or most. Look at your last ten projects and note on which ones AI touched a deliverable; that share is your honest comparator.
- Start with text work, where measured use is highest. NBS (2025) found 71.1% of AI users searching technical information and 63.8% drafting or reviewing text; the AJ found 64% using text tools weekly. Our Claude guide for architects and the prompt library cover reports, minutes, bid text and brief audits.
- Measure hours the way Chaos respondents reported them. 59% of AI users there said they save at least 5 hours a week, and 86% reported saving time on something. Log a fortnight of AI-assisted tasks with the minutes saved or lost, then compare your total with that 5-hour line.
- Verify every compliance output before it leaves the office. 40% of RIBA’s AI-using practices apply AI to compliance checking. Treat each output as a draft to check against the current code edition for your jurisdiction, by the licensed professional who signs; our code-check guide lists the specific failure modes.
- Write the policy. Only around 19% of RIBA practices have a documented AI policy, 17% are developing one and 15% plan to. One page covering what client data may go into which tool, who checks outputs, and how AI use is disclosed is enough to start.
FAQ
What percentage of architects use AI?
It depends on the question asked. According to the RIBA AI Report 2026 (survey March-April 2026), 74% of UK practices use AI on at least some projects and 15% say it is embedded. The AIA (fieldwork 2024) found 6% of US architects using AI regularly. NBS (2025) found 49% of architecture professionals using AI.
What do architects use AI for most?
Early-design images and text work. RIBA’s 2026 survey puts early-stage design visualisation first at 56% of AI-using practices, then compliance checking at 40%, practice management at 32% and specification or technical design at 24%. Where surveys ask about text, it leads: NBS (2025) found 71.1% of AI users searching technical information and 63.8% drafting or reviewing text, and the AJ (October 2025) found 64% using text tools weekly.
Which AI tool do architects use most?
ChatGPT. The NBS Digital Construction Report 2025 found 86.8% of AI users on ChatGPT, 57.9% on Microsoft Copilot, 36.8% on Google Gemini and 15.1% on Claude. The Architects’ Journal (October 2025) found 77% using ChatGPT and 27% Copilot, while Midjourney fell from 42% to 22% in a year. General chat assistants dominate; specialised architecture tools barely register in these samples.
Is AI making architects’ designs better?
Most respondents say no. In the RIBA AI Report 2026 (survey March-April 2026), 17% agree “our designs are better because of AI” and 42% disagree, even though 73% of AI users report improved productivity. In the Chaos survey (November 2025), 60% say AI enhances some aspects but introduces new errors or inconsistencies. Time savings are widely reported; design quality gains are claimed by a minority.
Did Archipractica survey architects itself?
No. We ran no survey and no test for this article. Everything here comes from seven published surveys by RIBA, AIA, Chaos with Architizer, NBS, Bluebeam, Deltek and the Architects’ Journal, and we checked each figure against the publisher’s own PDF or press release on 20 October 2026. Where the sources disagree about how architects use AI, we explain the method differences and let you pick the number that matches your question.
Sources
- RIBA - Artificial Intelligence Report 2026 (PDF) (22 July 2026, fieldwork March-April 2026)
- RIBA - AI adoption reaches tipping point across UK architecture (news release) (22 July 2026)
- AIA - New research explores perceptions and opportunities of artificial intelligence (press release for “Artificial Intelligence Adoption in Architecture Firms: Opportunities & Risks”, December 2024) (11 March 2025, fieldwork June-July 2024)
- Chaos and Architizer - How AI Is Reshaping Architectural Design & Visualization in 2026 (PDF) (2026, fieldwork November 2025)
- NBS - Digital Construction Report 2025 (download page) (2025 edition)
- NBS - AI adoption surges as digital anxiety grips the construction sector (press release) (7 October 2025)
- RIBA Journal - AI and technology uptake, Digital Construction Report 2025 (15 October 2025)
- Bluebeam - 2027 Building the Future: AEC Technology Outlook (press release) (13 October 2026, fieldwork July 2026)
- Deltek - Clarity 47th Annual Architecture & Engineering Industry Study (press release) (12 May 2026)
- Architects’ Journal - AI in practice: ChatGPT use far outstrips Midjourney, AJ survey shows (3 October 2025)
- Architects’ Journal - Architects fear AI will cost jobs and harm profession’s next generation, RIBA finds (23 July 2026)
If you want the next survey on how architects use AI read against its PDF before you quote it, along with one workflow we have run ourselves, the newsletter does that weekly. Subscribe.